Debugging Your JavaScript Code: Because Nothing is Perfect, Not Even Your Code!


Are you a JavaScript developer struggling with bugs and errors in your code? Fret not, my friend, for you are not alone. Debugging can be a daunting task, but with a little bit of patience and the right approach, you can squash those pesky bugs and have your code running smoothly in no time.
In this blog post, we'll go over some tips and tricks to help you debug your JavaScript code like a pro. From using console.log to setting breakpoints, we've got you covered. So, let's get started!
Use console.log like a pro
Ah, console.log, the tried and true debugging tool. It may seem basic, but it can be incredibly useful in pinpointing the source of an error. By logging relevant values and variables to the console, you can see exactly what's happening at each step of your code's execution.
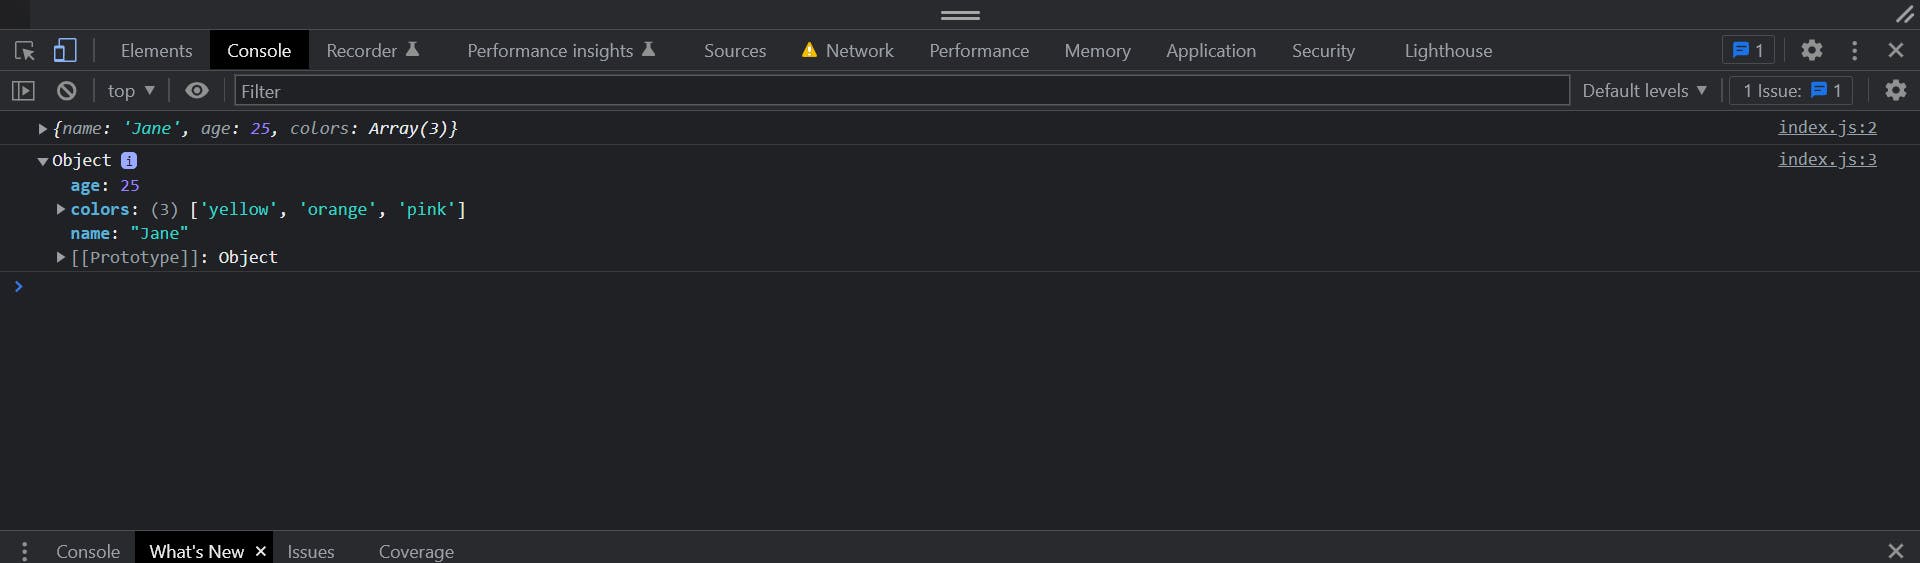
console.log() vs console.dir()
While console.log() prints the object in its string representation, console.dir() recognizes the object as an object and prints its properties in the form of a clean expandable list:
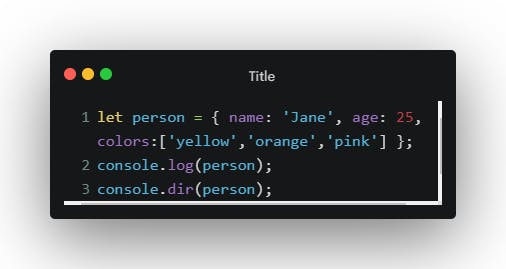
output:
Here are some additional tips and tricks for console logging:
Use
console.error()to log errors. This will make the log stand out and be easier to spot.Use
console.assert()to test conditions. If the condition is false, an error will be logged.Use
console.time()andconsole.timeEnd()to time how long a block of code takes to execute.Use
console.group()andconsole.groupEnd()to group related logs together.
Take advantage of breakpoints
If you're using a code editor like VS Code, you can set breakpoints in your code to pause execution at a specific line. This allows you to step through your code one line at a time and see exactly what's happening at each step.
Breakpoints can be especially helpful when you're dealing with complex or nested code. By pausing execution at a specific line, you can get a better understanding of what's happening in your code and catch errors before they cause bigger problems.
Use browser tools for debugging
Most modern browsers come with built-in developer tools that can help you debug your code. From the Console tab to the Debugger tab, these tools provide a wealth of information about your code's execution.
The Console tab is similar to console.log in that it allows you to log values and variables, but it also provides information about network requests, errors, and warnings.
The Debugger tab allows you to set breakpoints and step through your code, just like in VS Code. But it also provides information about call stacks, scope variables, and more.
Simplify your code
Sometimes, the best way to debug your code is to simplify it. If you're dealing with a complex function or block of code, try breaking it down into smaller, more manageable pieces.
This can help you isolate the source of an error and make it easier to debug. Plus, it can make your code more readable and maintainable in the long run.
Ask for help (no shame in that!)
Let's face it, sometimes we all get stuck. And that's okay! There's no shame in asking for help when you need it.
Reach out to fellow developers, post on forums or social media, or even consider hiring a mentor. Sometimes, a fresh pair of eyes can catch something you've been overlooking.
There you have it, folks. Debugging your JavaScript code doesn't have to be a nightmare. By using these tips and tricks, you can become a debugging pro in no time. Just remember to be patient, be strategic, and don't be afraid to ask for help when you need it. Happy debugging!